Confusion Between Groups and Individuals
Ecological fallacy can refer to the following statistical fallacy: the correlation between individual variables is deduced from the correlation of the variables collected for the group to which those individuals belong. As an example, assume that at the individual level, being Protestant impacts negatively one's tendency to commit suicide, but the probability that one's neighbor commits suicide increases one's tendency to become Protestant. Then, even if at the individual level there is negative correlation between suicidal tendencies and Protestantism, there can be a positive correlation at the aggregate level.
Choosing Between Aggregate and Individual Inference
Running regressions on aggregate data is not unacceptable if one is interested in the aggregate model. For instance, as a governor, it is correct to make inferences about the effect the size of a police force would have on the crime rate at the state level, if one is interested in the policy implication of a rise in police force. However, an ecological fallacy would happen if a city council deduces the impact of an increase in the police force on the crime rate at the city level from the correlation at the state level.
Choosing to run aggregate or individual regressions to understand aggregate impacts on some policy depends on the following trade off: aggregate regressions lose individual level data but individual regressions add strong modeling assumptions.
Some researchers suggest that the ecological correlation gives a better picture of the outcome of public policy actions, thus they recommend the ecological correlation over the individual level correlation for this purpose. Other researchers disagree, especially when the relationships among the levels are not clearly modeled. To prevent ecological fallacy, researchers with no individual data can model first what is occurring at the individual level, then model how the individual and group levels are related, and finally examine whether anything occurring at the group level adds to the understanding of the relationship.
Groups and Total Averages
Ecological fallacy can also refer to the following fallacy: the average for a group is approximated by the average in the total population divided by the group size. Suppose one knows the number of Protestants and the suicide rate in the USA, but one does not have data linking religion and suicide at the individual level. If one is interested in the suicide rate of Protestants, it is a mistake to estimate it by the total suicide rate divided by the number of Protestants.
Simpson's Paradox
A striking ecological fallacy is Simpson's paradox, diagramed in . Simpson's paradox refers to the fact, when comparing two populations divided in groups of different sizes, the average of some variable in the first population can be higher in every group and yet lower in the total population.
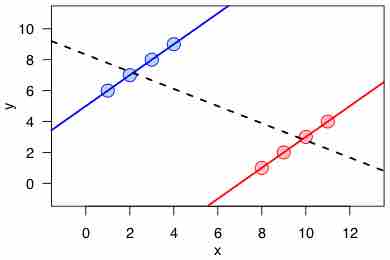
Simpson's Paradox
Simpson's paradox for continuous data: a positive trend appears for two separate groups (blue and red), a negative trend (black, dashed) appears when the data are combined.
Mean and Median
A third example of ecological fallacy is when the average of a population is assumed to have an interpretation in terms of likelihood at the individual level.
For instance, if the average score of group A is larger than zero, it does not mean that a random individual of group A is more likely to have a positive score. Similarly, if a particular group of people is measured to have a lower average IQ than the general population, it is an error to conclude that a randomly selected member of the group is more likely to have a lower IQ than the average general population. Mathematically, this comes from the fact that a distribution can have a positive mean but a negative median. This property is linked to the skewness of the distribution.
Consider the following numerical example:
Group A: 80% of people got 40 points and 20% of them got 95 points. The average score is 51 points.
Group B: 50% of people got 45 points and 50% got 55 points. The average score is 50 points.
If we pick two people at random from A and B, there are 4 possible outcomes:
- A - 40, B - 45 (B wins, 40% probability)
- A - 40, B - 55 (B wins, 40% probability)
- A - 95, B - 45 (A wins, 10% probability)
- A - 95, B - 55 (A wins, 10% probability)
Although Group A has a higher average score, 80% of the time a random individual of A will score lower than a random individual of B.